


About this app
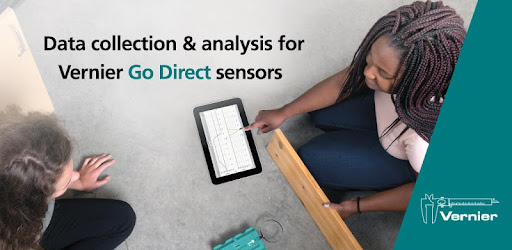
Graphical Analysis™ is a tool for science students to collect, graph, and analyze data from Vernier sensors.
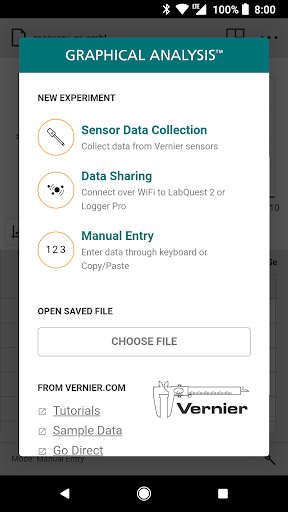
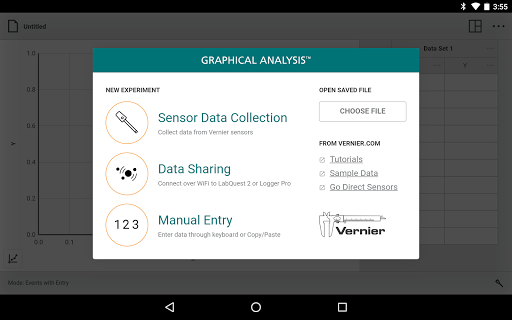
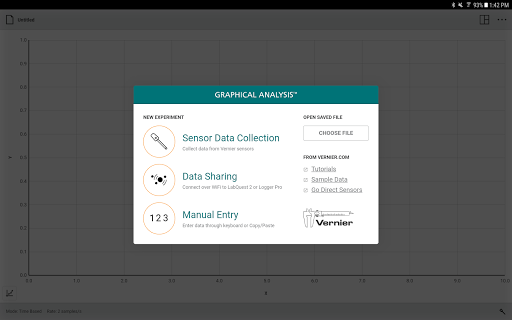
Sensor data-collection support:
• Vernier Go Direct® sensors - with Bluetooth® wireless technology
• Vernier Go Wireless® Heart Rate and Go Wireless Exercise Heart Rate monitors
Additional experiment options:
• Data Sharing via Wi-Fi connection to LabQuest 2, LabQuest 3 or Logger Pro® 3
• Manual Entry
Note: Sensor data collection and Data Sharing require the purchase of hardware from Vernier Software & Technology. Manual entry of data can be performed without a hardware purchase. For more information on Data Sharing, visit http://www.vernier.com/css
Key Features - Data Collection
• Multi-sensor data-collection support
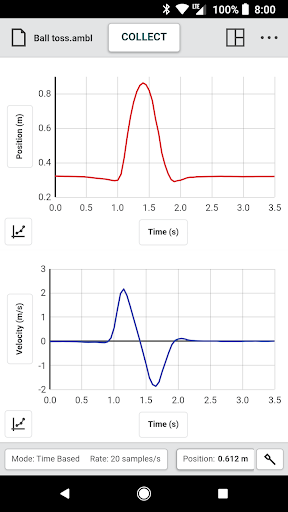
• Time Based, Event Based, and Drop Counting data-collection modes
• Configurable data-collection rate and duration for time-based data collection
• Optional triggering of time-based data collection based on sensor value
• Customizable unit display on supported sensors
• Sensor calibrations
• Option to zero and reverse sensor readings
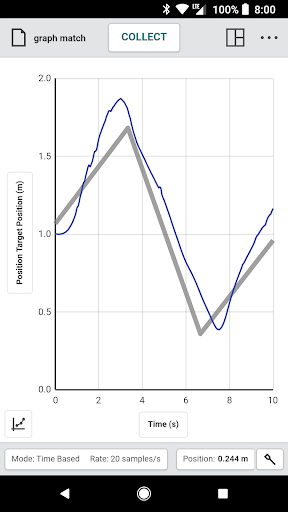
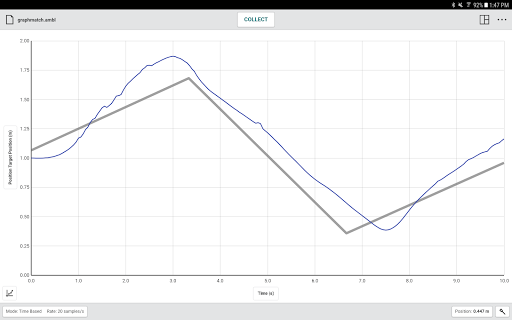
• Graph match feature for use with motion detectors
• Manual entry of data from keyboard and clipboard
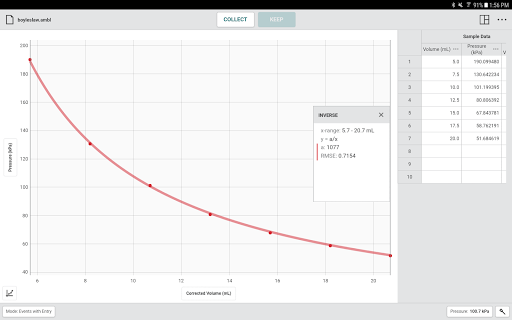
Key Features - Data Analysis
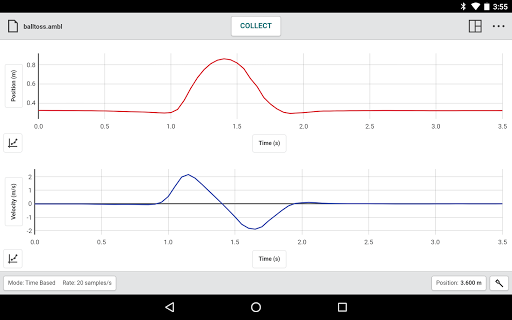
• Display one, two, or three graphs simultaneously
• View data in a table or show a graph and table side-by-side
• Draw Predictions on a graph to uncover misconceptions
• Examine, interpolate/extrapolate, and select data
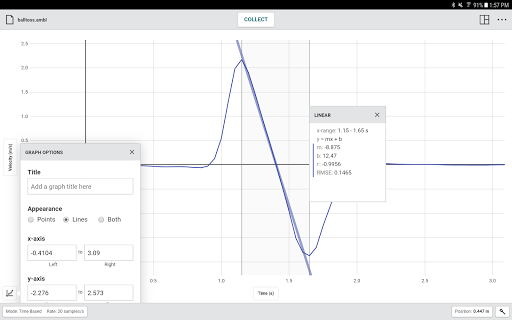
• Use Tangent tool to show instantaneous rates of change of the data
• Find area under a curve using the Integral tool
• Apply Statistics calculations to find mean, min, max, and standard deviation
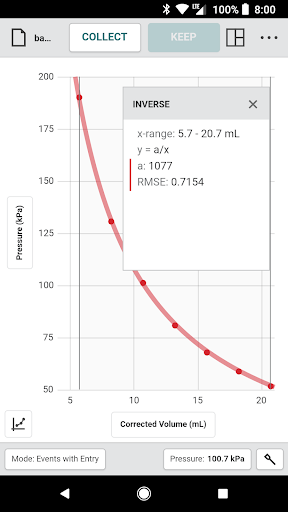
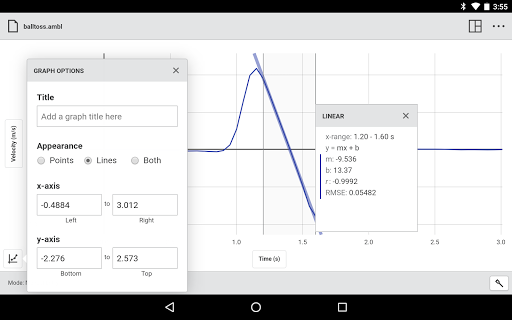
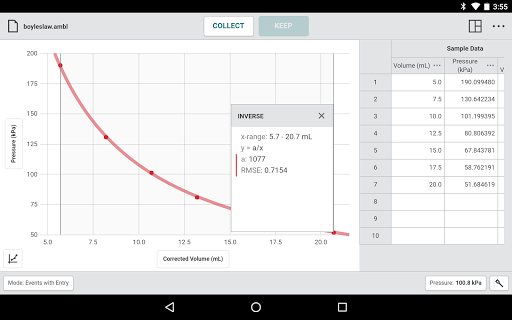
• Perform curve fits, including linear, quadratic, natural exponent, and more
• Add calculated columns based on existing data to linearize data or investigate related concepts
Key Features - Collaboration and Sharing
• Create text annotations and add graph titles
• Export graphs and data for printing and inclusion in lab reports
• Save files (.ambl file format) to the Cloud for exchange with Graphical Analysis on other Android™ devices, Chromebooks™, Windows® and macOS® computers, and iOS devices
• Export data in .CSV format for analysis of data in spreadsheet software such as Excel, Google Sheets, and Numbers
• Adjust font sizes for easier viewing when presenting to your class
Vernier Software & Technology has over 35 years of experience in providing effective learning resources for understanding experimental data in science and math classrooms. Graphical Analysis is a part of the extensive system of sensors, interfaces, and data-collection software from Vernier for science and STEM education.
Downloads
1.2.3.4.5.6.7.8.9.0
LATEST
10/23/2023
Download
46.11 MB
1.2.3.4.5.6.7.8.9.0
LATEST10/23/2023
Supported Architectures
MD5 Checksum
7598c871fb27c2021f9504f2e27cdb7c
Minimum SDK Version
29
Version Code
5408
Upload Date
Oct 23, 2023, 3:33:45 AM
1.2.3.4.5.6.7.8.9.0
10/13/2023
Download
46.12 MB
1.2.3.4.5.6.7.8.9.0
10/13/2023
Supported Architectures
MD5 Checksum
43106200f4affde6d017c12d1591ff5c
Minimum SDK Version
29
Version Code
5383
Upload Date
Oct 13, 2023, 10:50:12 AM
1.2.3.4.5.6.7.8.9.0
09/02/2023
Download
46.07 MB
1.2.3.4.5.6.7.8.9.0
09/02/2023
Supported Architectures
MD5 Checksum
0f52486bc1a0e9f874ee83a4614b558b
Minimum SDK Version
29
Version Code
5298
Upload Date
Sep 2, 2023, 3:42:18 AM
Similar Apps
Starfall Turkey
5.0
everyone
Total Reflexology 3D
5.0
everyone
ATI TEAS - ArcherReview
5.0
everyone
잔소리 일단어
5.0
everyone
Fun With Flupe - English Words
5.0
everyone
UX Research Course- ProApp
5.0
everyone
The Dream Box, Bedtime stories
5.0
everyone
Полиглот. Говорим по-английски
5.0
everyone
Mondly Language Training Hub
5.0
everyone
Tolerance and fits ISO
5.0
everyone